Integrative Conservation Clinic - Capstone Case Study
Objective:
Design a conservation database tailored to the specific needs of sustainability professionals. Create an intuitive and efficient tool that supports data management, enhances accessibility, and facilitates informed decision-making in conservation efforts.
Client: Dr. Alexandra Sabo, William and Mary University
Project Duration: September 2022 - April 2023
Roles: UI Design, User Research, Usability Testing, Outreach
Tools: Figma, Optimal Workshop, Miro, Zoom, Photoshop, XD
Project Team: Shannon Halycz, Sanskar Gupta, Kareem Al-Lababidi, Yusra Farrukh, Lakshan Gunajothy, Matteo Distefano, Mason Wright
Early Design Iterations
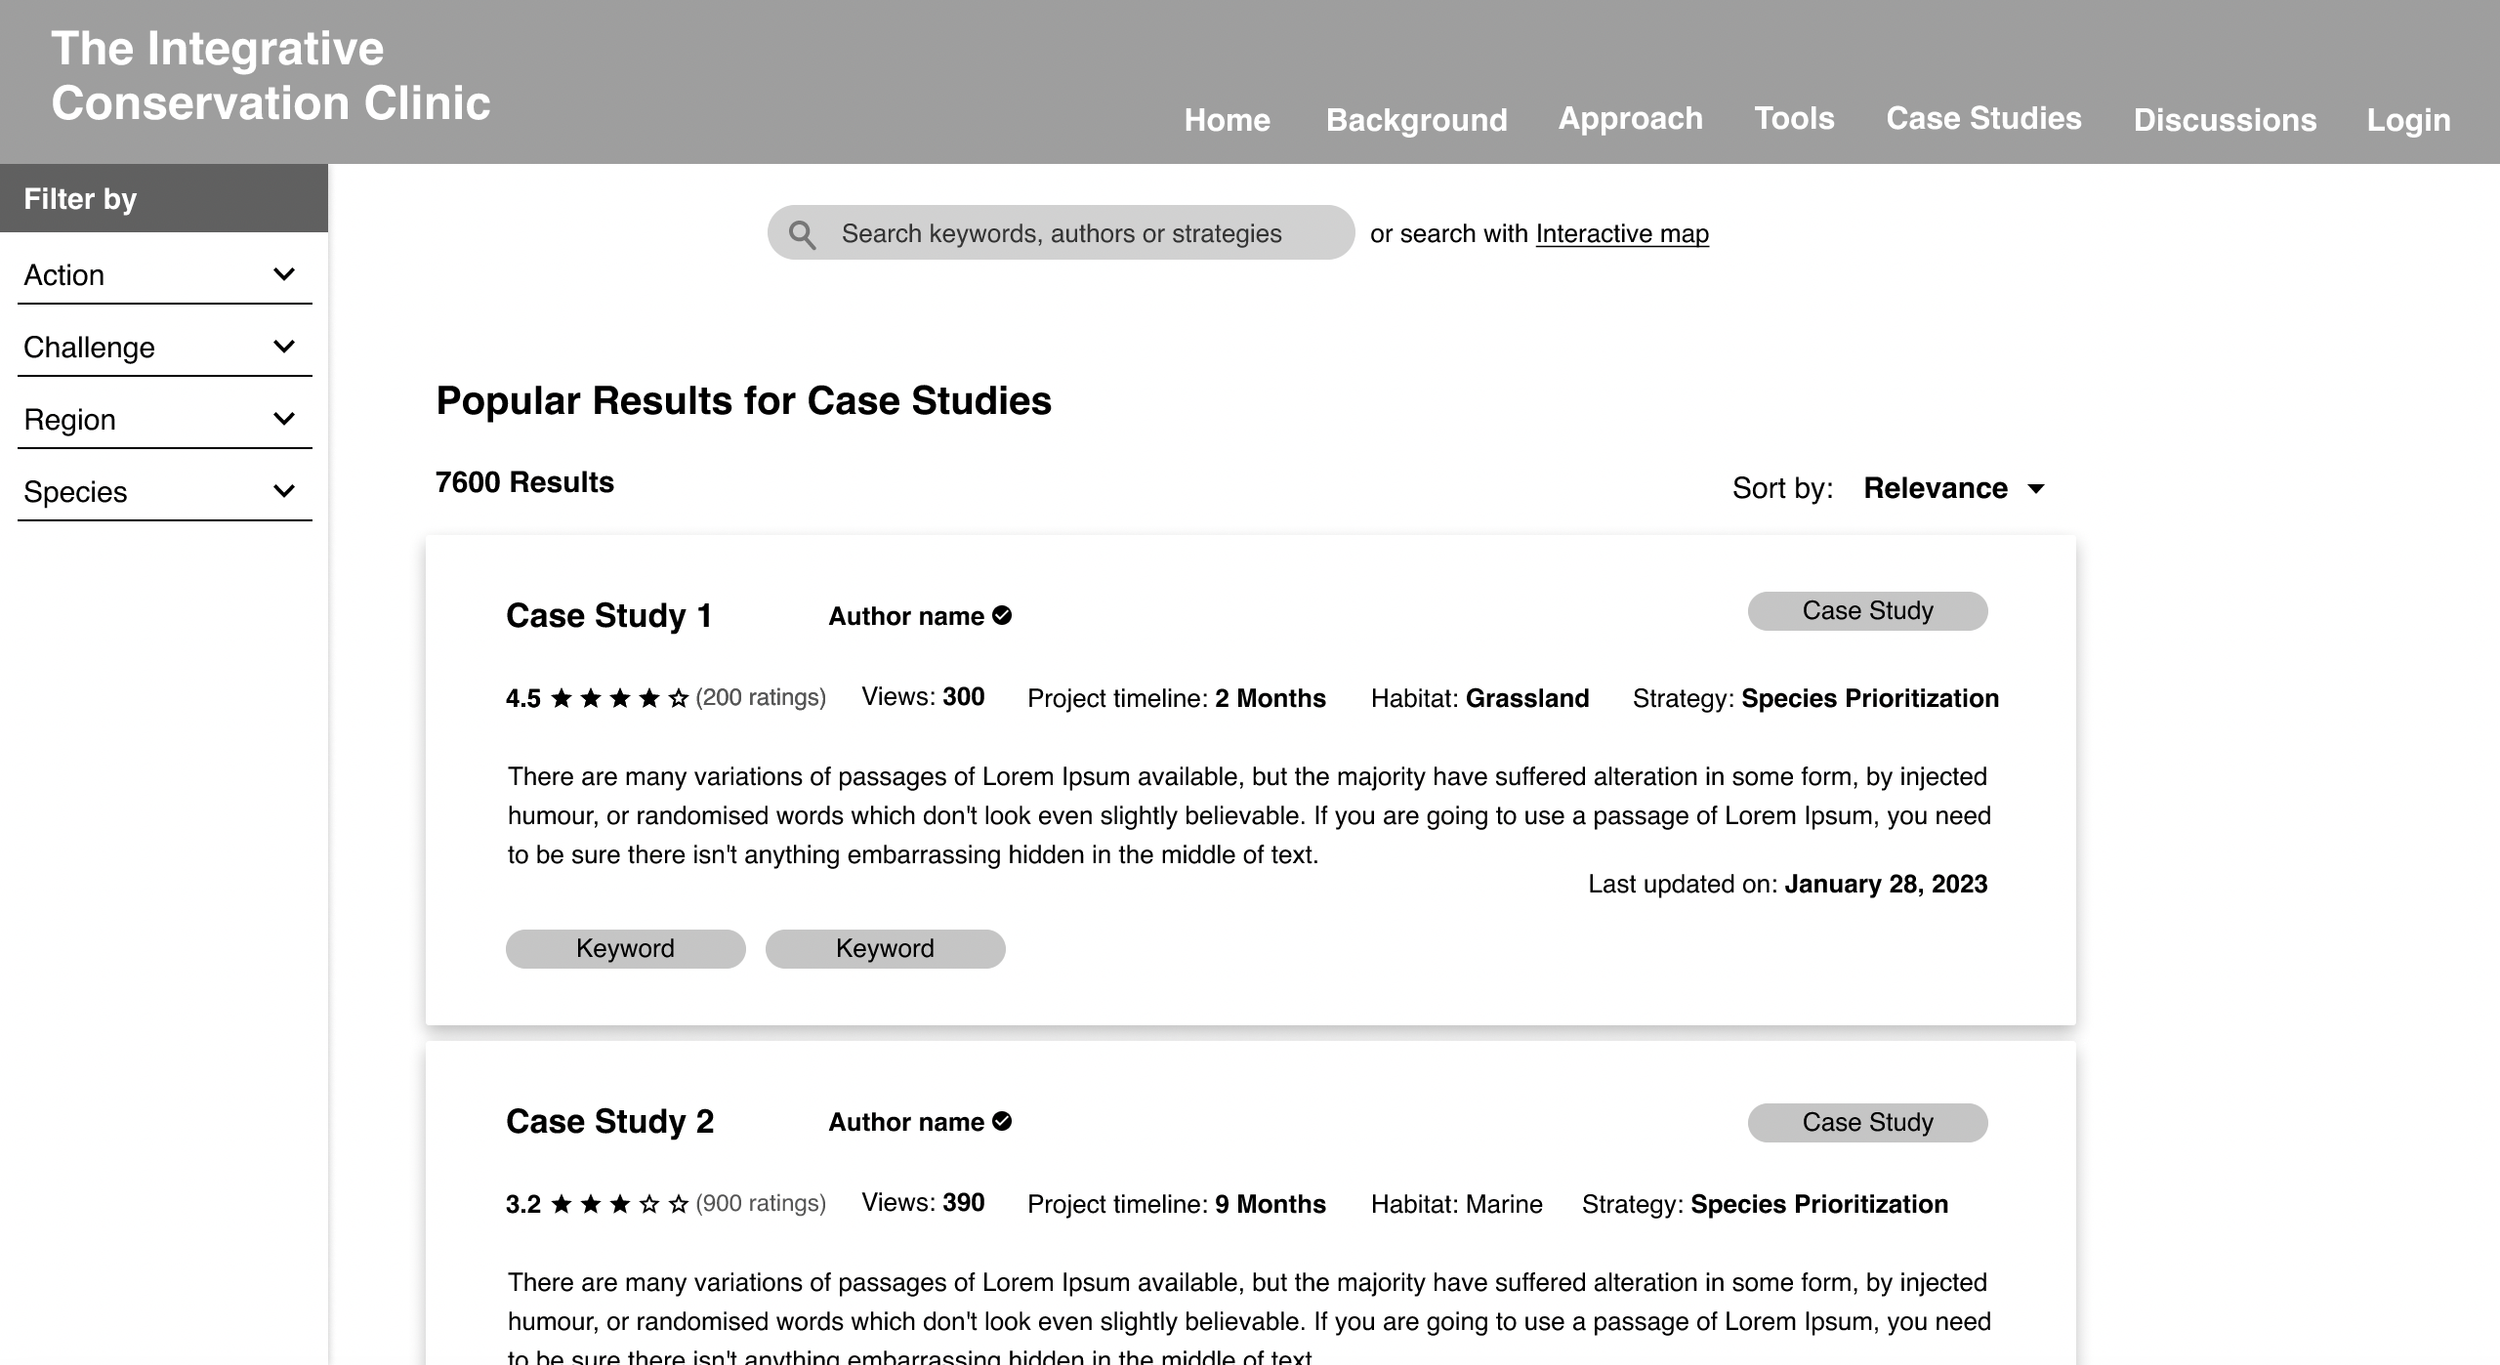
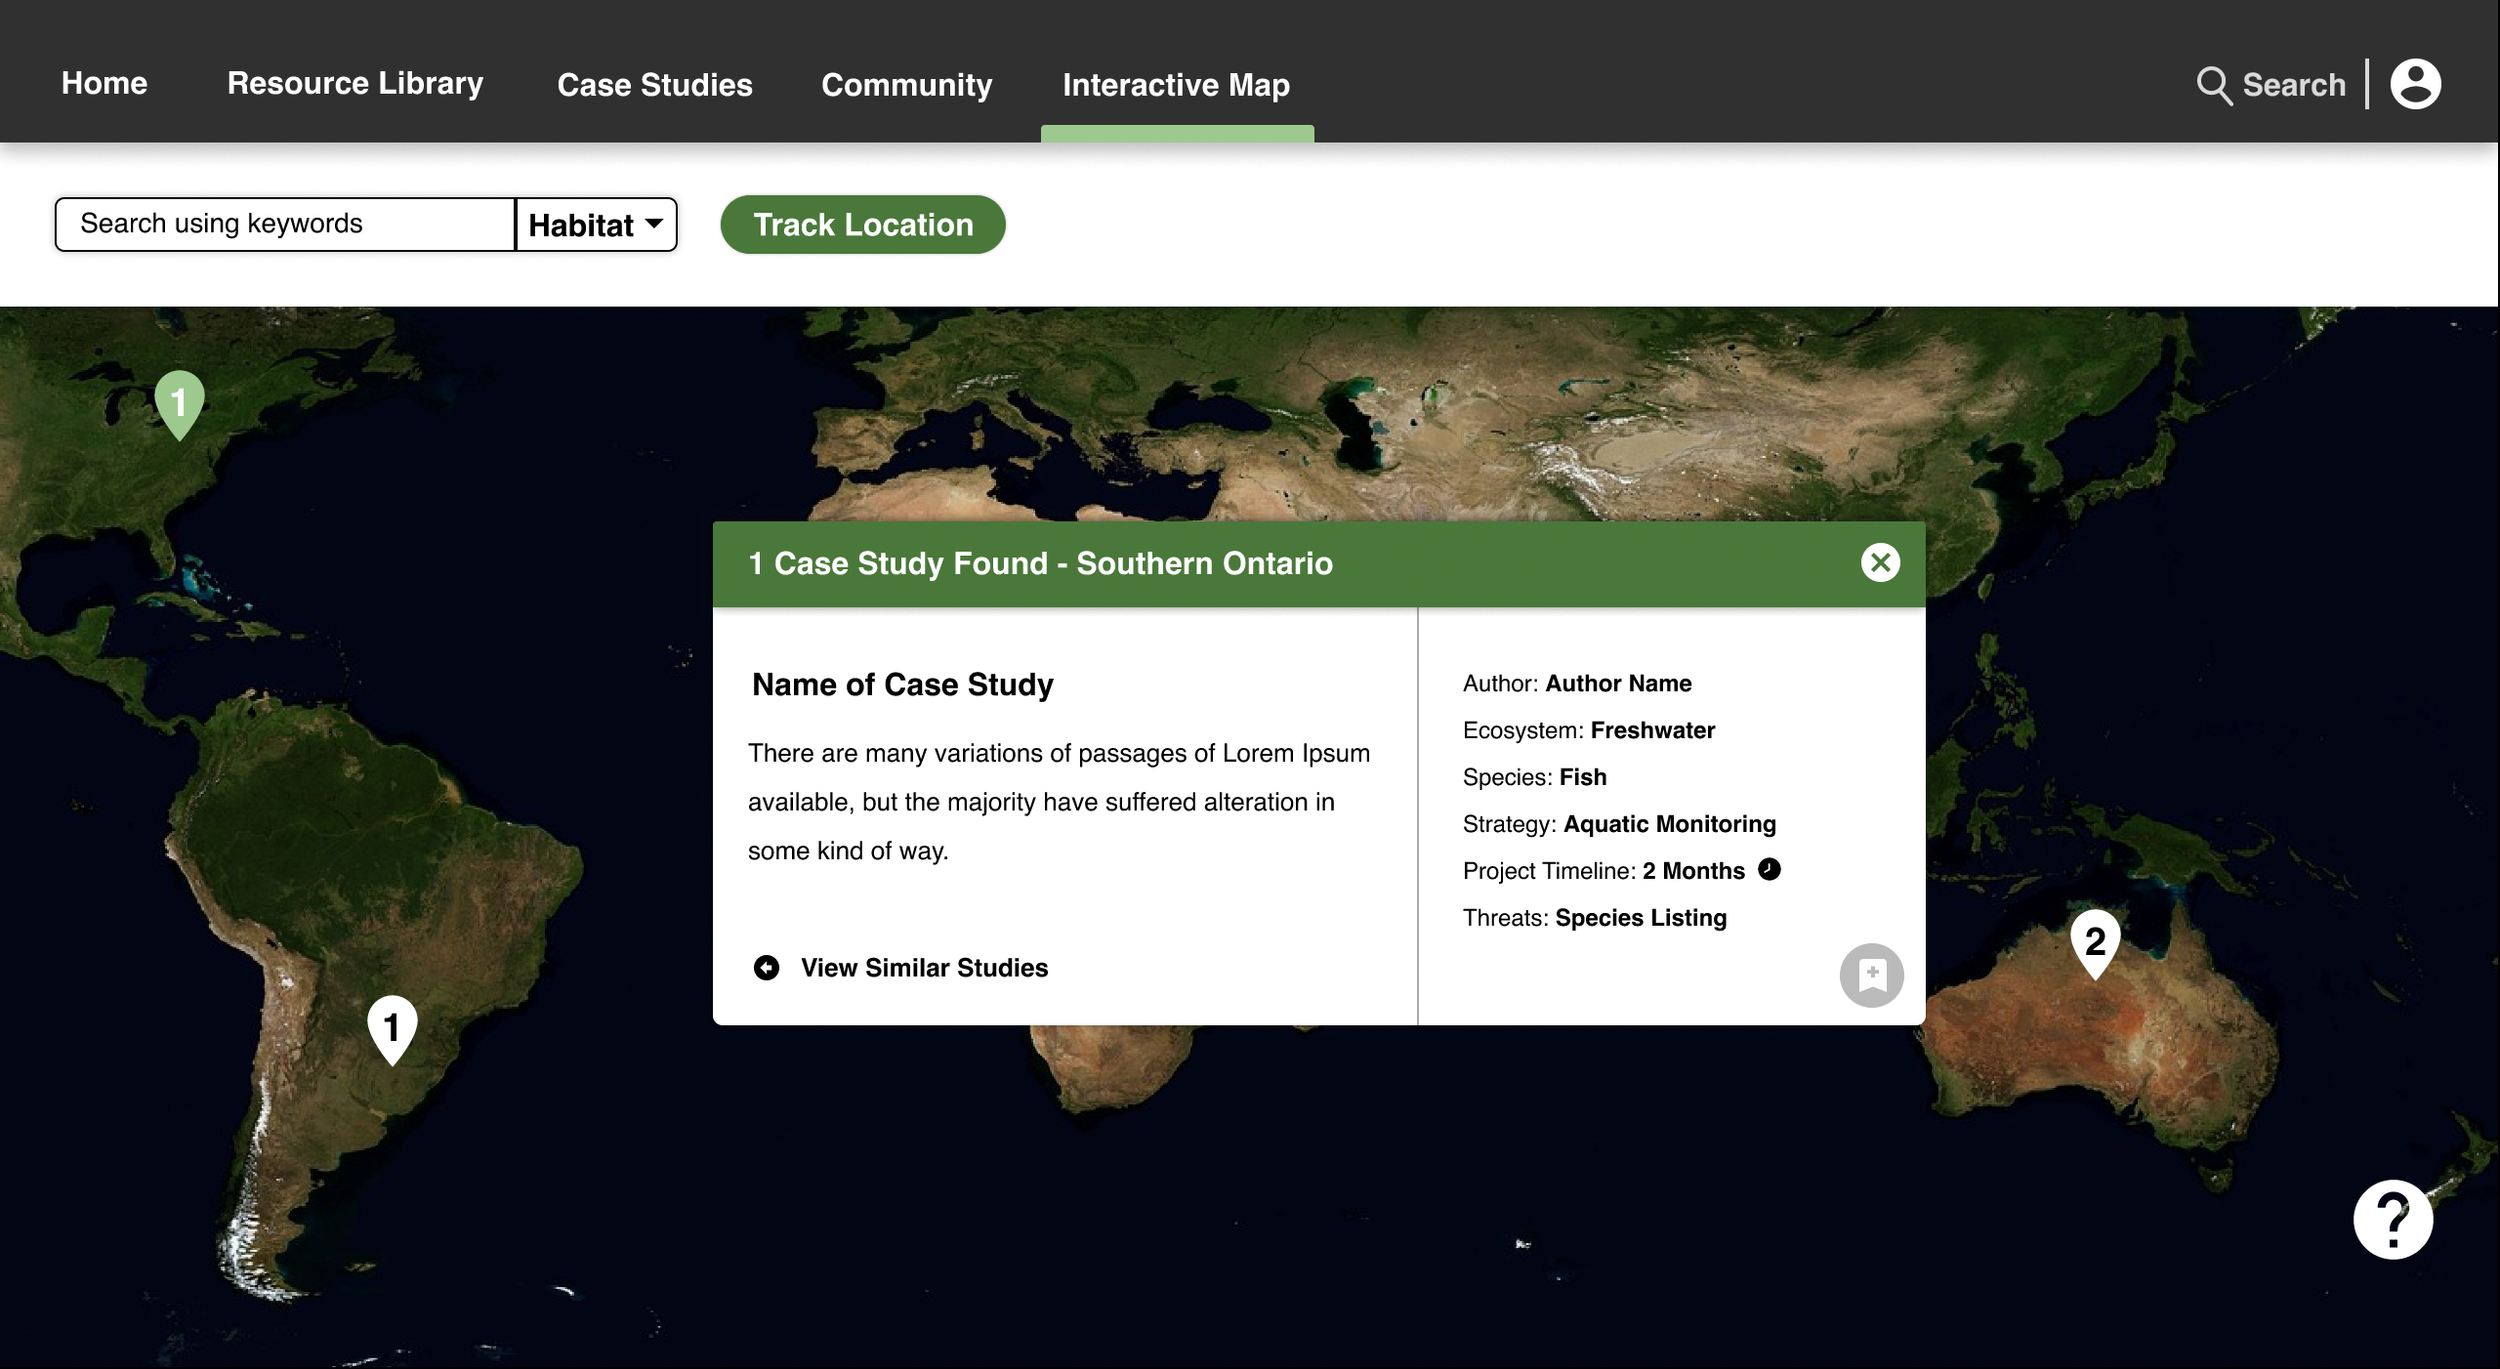
Final Design Iterations
The Problem.
The Integrative Conservation Clinic approached our team with a challenge: to design an open-source database where ecological conservation practitioners could contribute, engage with, and learn from collective research. The original concept aimed to organize information through a three-layered approach—background, approaches, and tools. However, our research revealed deeper issues that needed addressing.
The primary problem was the lack of convenience and accessibility in finding reliable research. Practitioners were often forced to navigate multiple platforms to locate the information they needed, leading to inefficiency and frustration. Additionally, the quality and validity of available resources were inconsistent, further complicating the research process.
We also uncovered a critical collaboration gap: practitioners often rely on peer feedback, but existing platforms didn’t provide sufficient functionality for connecting and communicating with colleagues. This hindered their ability to gain valuable insights and exchange expertise.
Through user research, we identified that the platform's users varied in experience levels and goals, presenting a challenge in designing a solution that could meet diverse needs. Some users focused on finding relevant information, while others aimed to build partnerships or raise awareness.
The design challenge was to create a dynamic, user-friendly database that not only organized and filtered vast amounts of conservation data but also facilitated meaningful collaboration between practitioners globally. Additionally, the platform needed to support varied research needs, allowing users to search content intuitively and engage with peers to improve the quality of their work.
In essence, the challenge was to create a comprehensive, interactive platform that bridged gaps in information access, quality, and practitioner collaboration.
Research & Discovery Phase.
Competitive Analysis
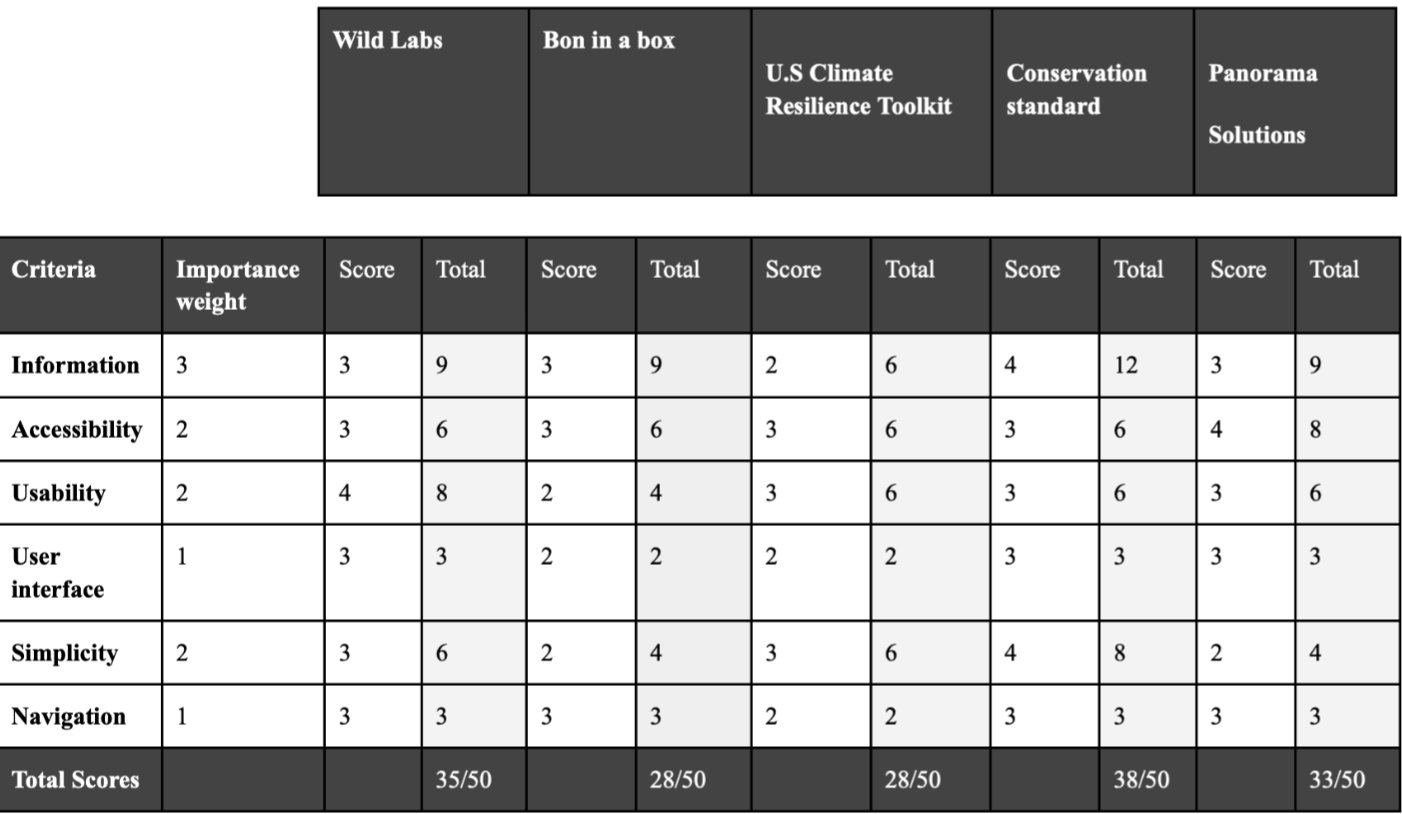
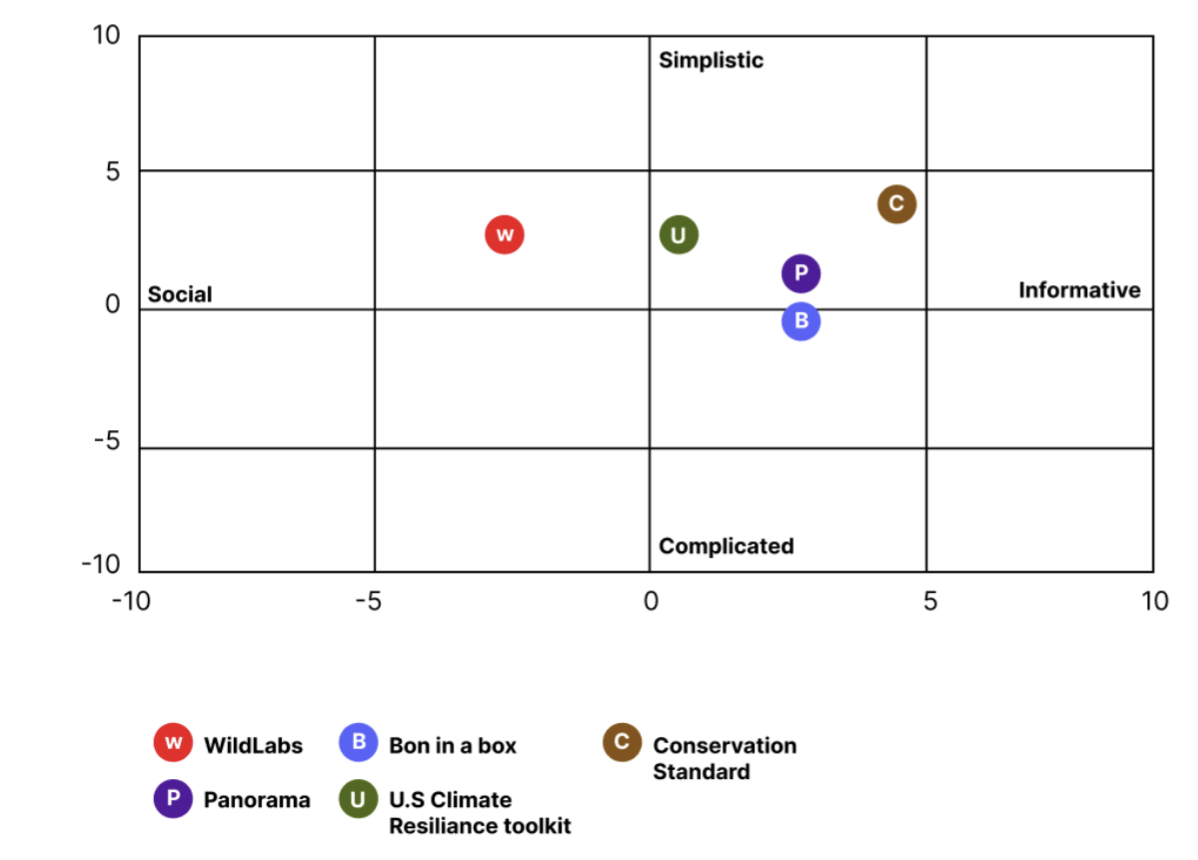
To better understand the competitive landscape, we analyzed five existing conservation websites: Wild Labs, Bon in a Box, U.S. Climate Resilience Toolkit, Conservation Standards, and Panorama Solutions. While many of these sites needed visual updates, they offered valuable insights into useful functionalities, such as filtering search results and simple navigation. However, most relied heavily on text, lacking engaging visuals. This research helped us identify pain points and opportunities to design a more user-friendly solution.
Bon in a Box:
Focuses on biodiversity and data logs with a user-friendly design featuring three main categories. Its robust "Tools" filtering system stands out as a key strength for search functionality.
Conservation Standards:
Primarily relevant for partnerships and artifact housing, this site features intuitive filters by content medium, rating, and topic. Its approach to information architecture can inform our solution.
Panorama Solutions:
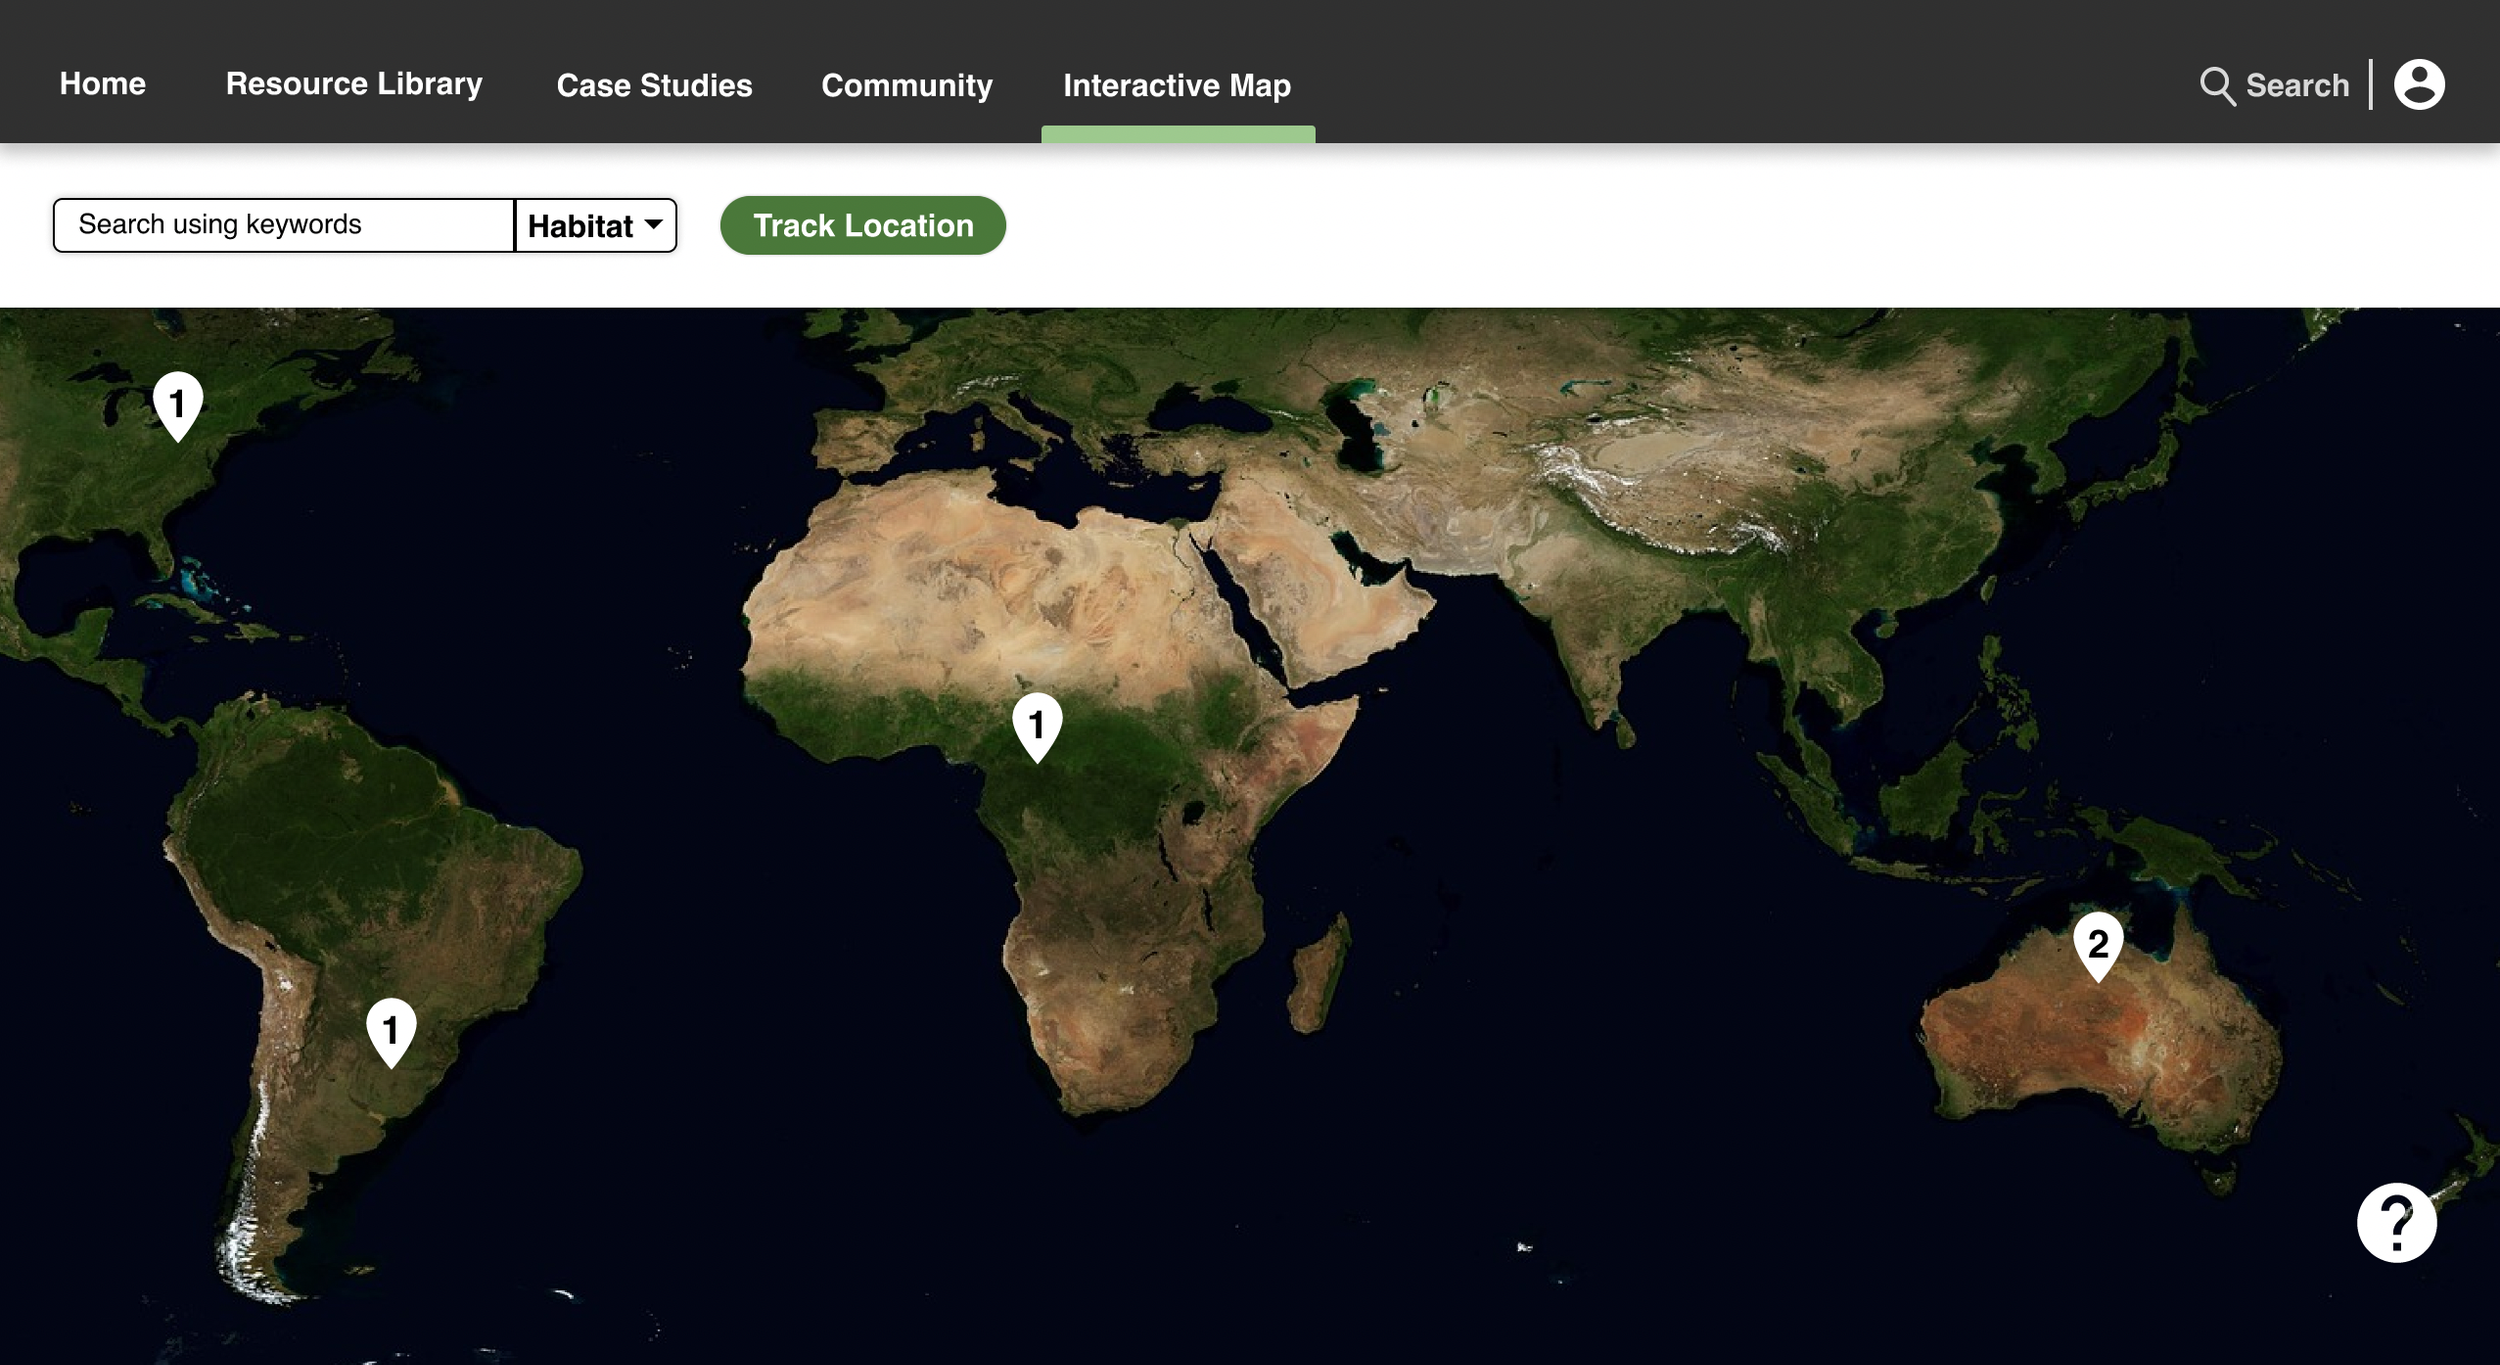
Highlights panoramic imagery and ecosystem-related solutions through an interactive map and curated filters (e.g., climate, economic, ecological). The curated list feature offers a simpler alternative to the map for search.
Wild Labs:
Lacks a meaningful filtering system, relying on a structured discussion board with limited collaboration options. Suggested improvements include tags like "Popular right now" and linking threads to related research for better navigation and engagement.
U.S. Climate Resilience:
Offers diverse navigation methods, but redundancy can overwhelm users. Key features include a regional search tab and a topics page that organizes content accessibly, providing inspiration for filtering and discussion design.
Competitors importance weight and scores.
Visual Matrix for all competitors.
2. Research Methods
Two research methods were used during the generative research phase. The first method used was surveys. Surveys were initially conducted by the client with over 128 users. The users surveyed were primarily managers working within NGOs and other conservation agencies, making them not our core user group. However, the information collected within the surveys was still analyzed and considered while developing future personas and journey maps.
The second research method used during this phase was semi-structured interviews. For this process, we were able to conduct 19 interviews overall. All participants were from North America. Though all interviewees were practitioners, their official fields of specialty were quite diverse having varying titles such as director of freshwater development, conservation technician, forestry technician, conservation education coordinator, manager of watershed development, and conservation researcher.
During the interviewing process, participants were asked various questions such as:
Can you summarize the responsibilities and goals of your position to someone unfamiliar with the field?
Can you identify some of the key tasks you face in your work?
Of these tasks, which do you find the most difficult and why?
Can you talk a bit about some of the resources you wish you had in your line of work?
What types of tools or resources do you use daily?
Can you explain some of the different forms of communication you use?
Can you talk about some of the frustrations you face within your line of work or conservation itself?
Can you describe the process you undertake when learning about something that you aren’t already familiar with?
What would be essential to help you educate the public?
The final research method employed was usability testing. In the initial phase, users engaged with our low-fi prototype by performing tasks related to the interactive map, discussions, and report page structure. We evaluated the design's effectiveness using three categories: pass, indirect, and fail. Participants also provided feedback through think-aloud sessions and follow-up questions. Usability issues were assessed based on their severity and frequency.
Our primary goals were to test learnability, task completion, and error minimization. We conducted the tests with six participants.
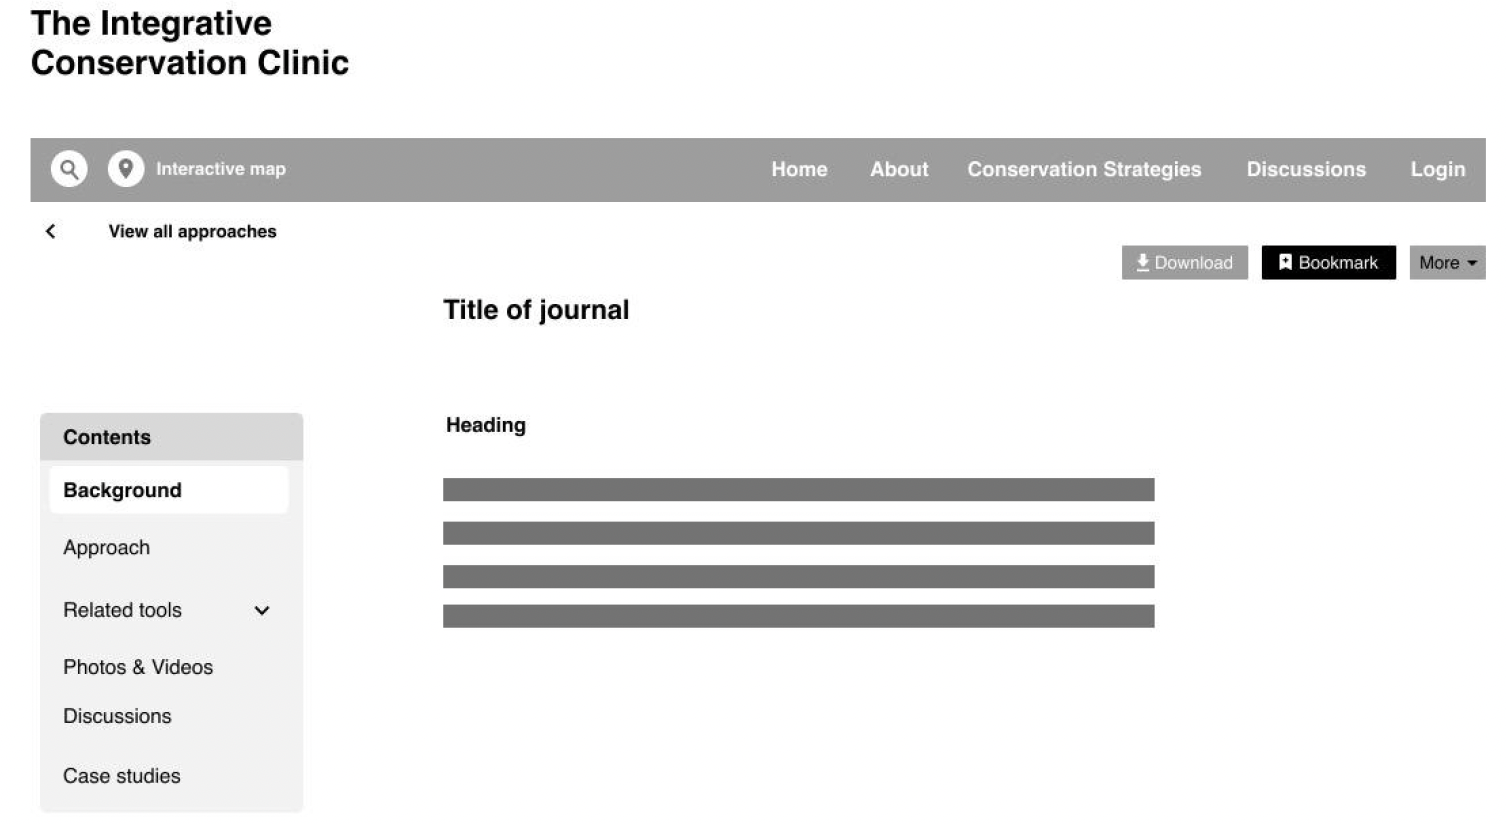
Low-Fidelity iteration used for initial usability testing.
In the second phase of testing, we introduced two new tasks focusing on bookmarking and update-requesting functionality for our mid-fi prototype. Testers were evaluated based on their task success and think-aloud feedback, with the high-level goals remaining the same. We conducted a total of nine tests for this iteration.
Medium-Fidelity iteration used for the second round of usability testing.
We then developed an initial high-fidelity prototype for further testing. In this phase, we aimed to evaluate how well users could complete tasks with the updated content structure. We continued to track task success and think-aloud feedback, and we added a new metric: the number of clicks needed to complete tasks. This provided additional insight into task difficulty. The high-level goals remained unchanged, and we invited participants from previous testing phases, as well as recruited five new participants.
High-fidelity iteration used for final usability testing.
3. Personas & Journey Maps
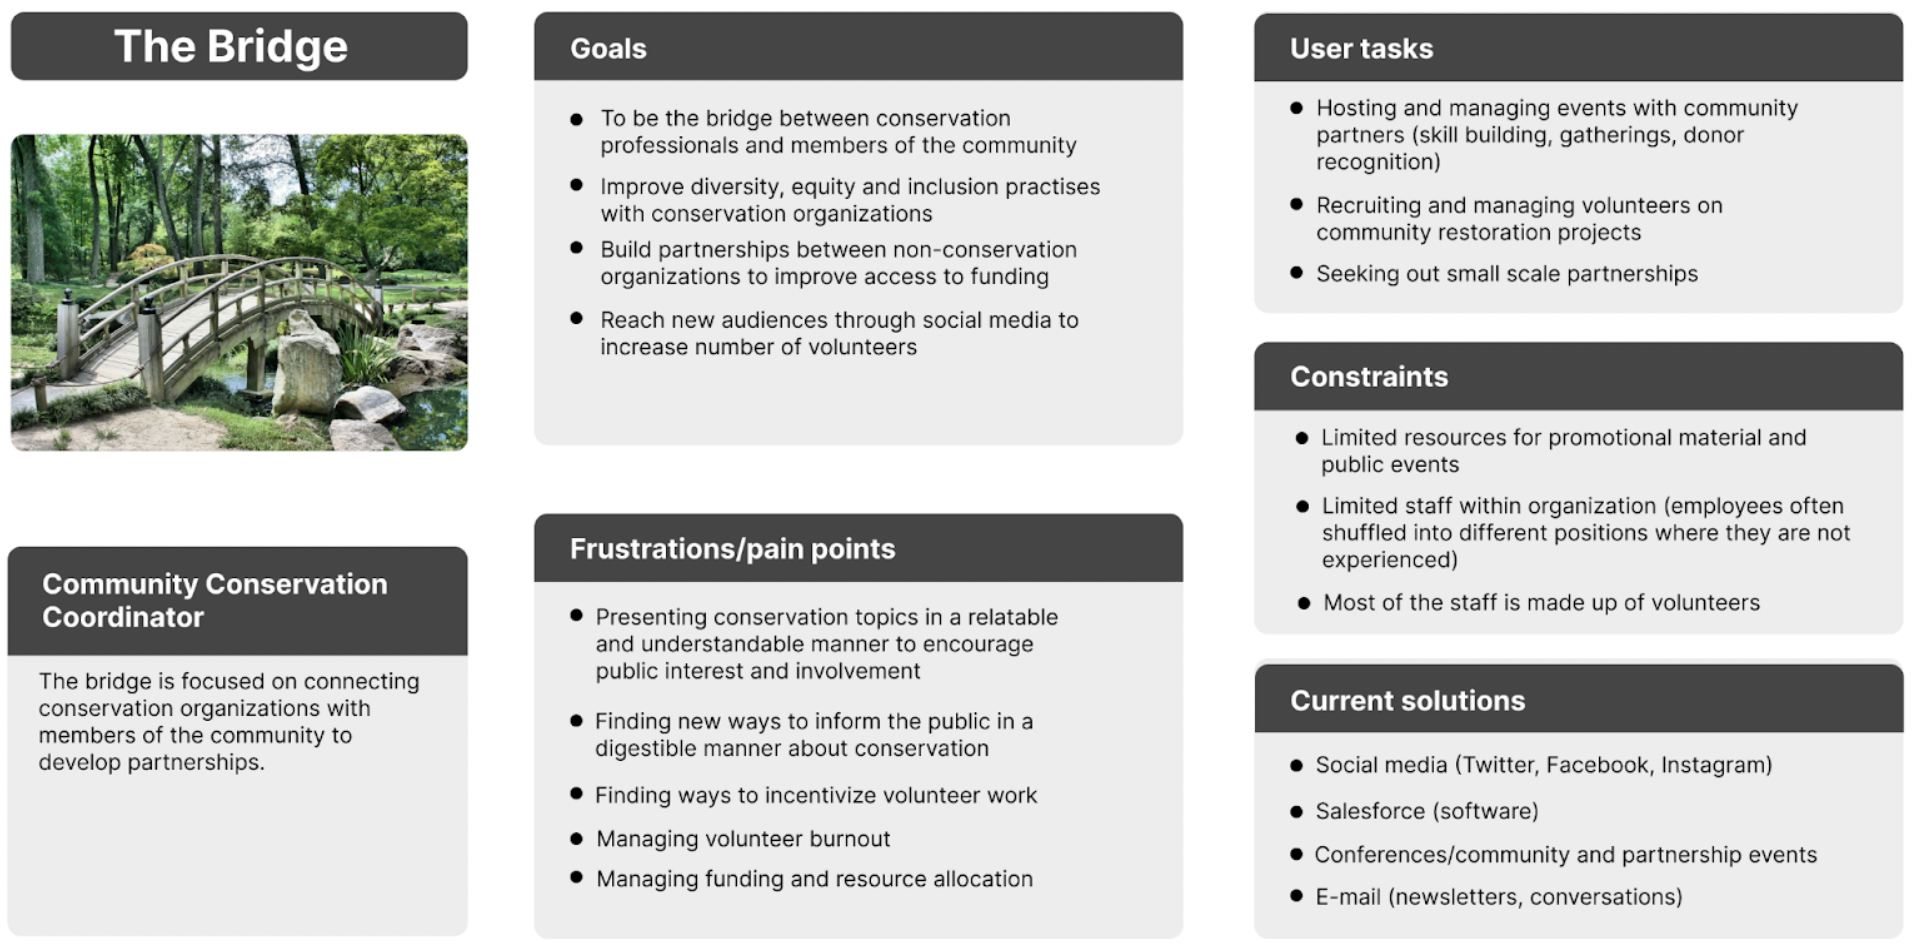
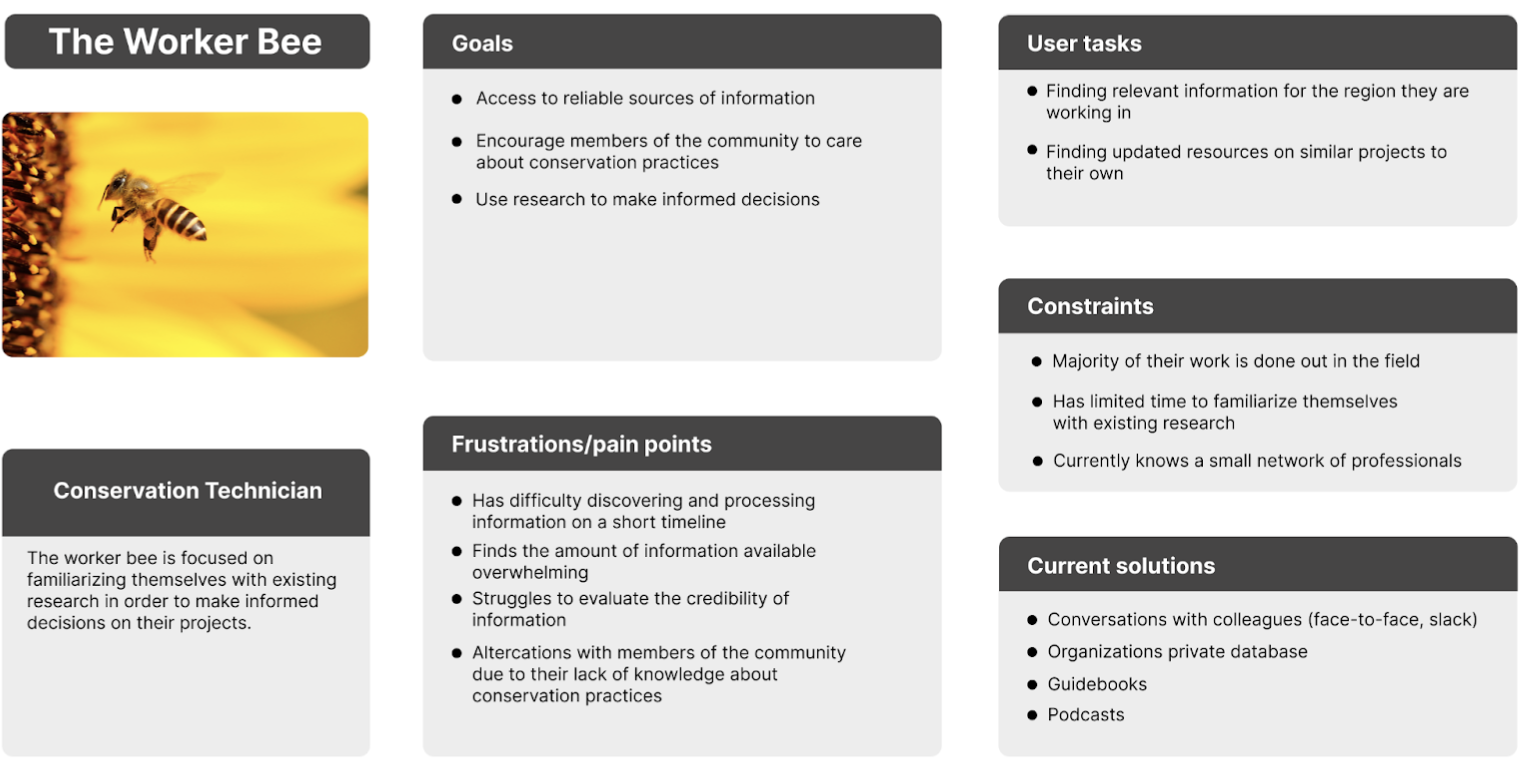
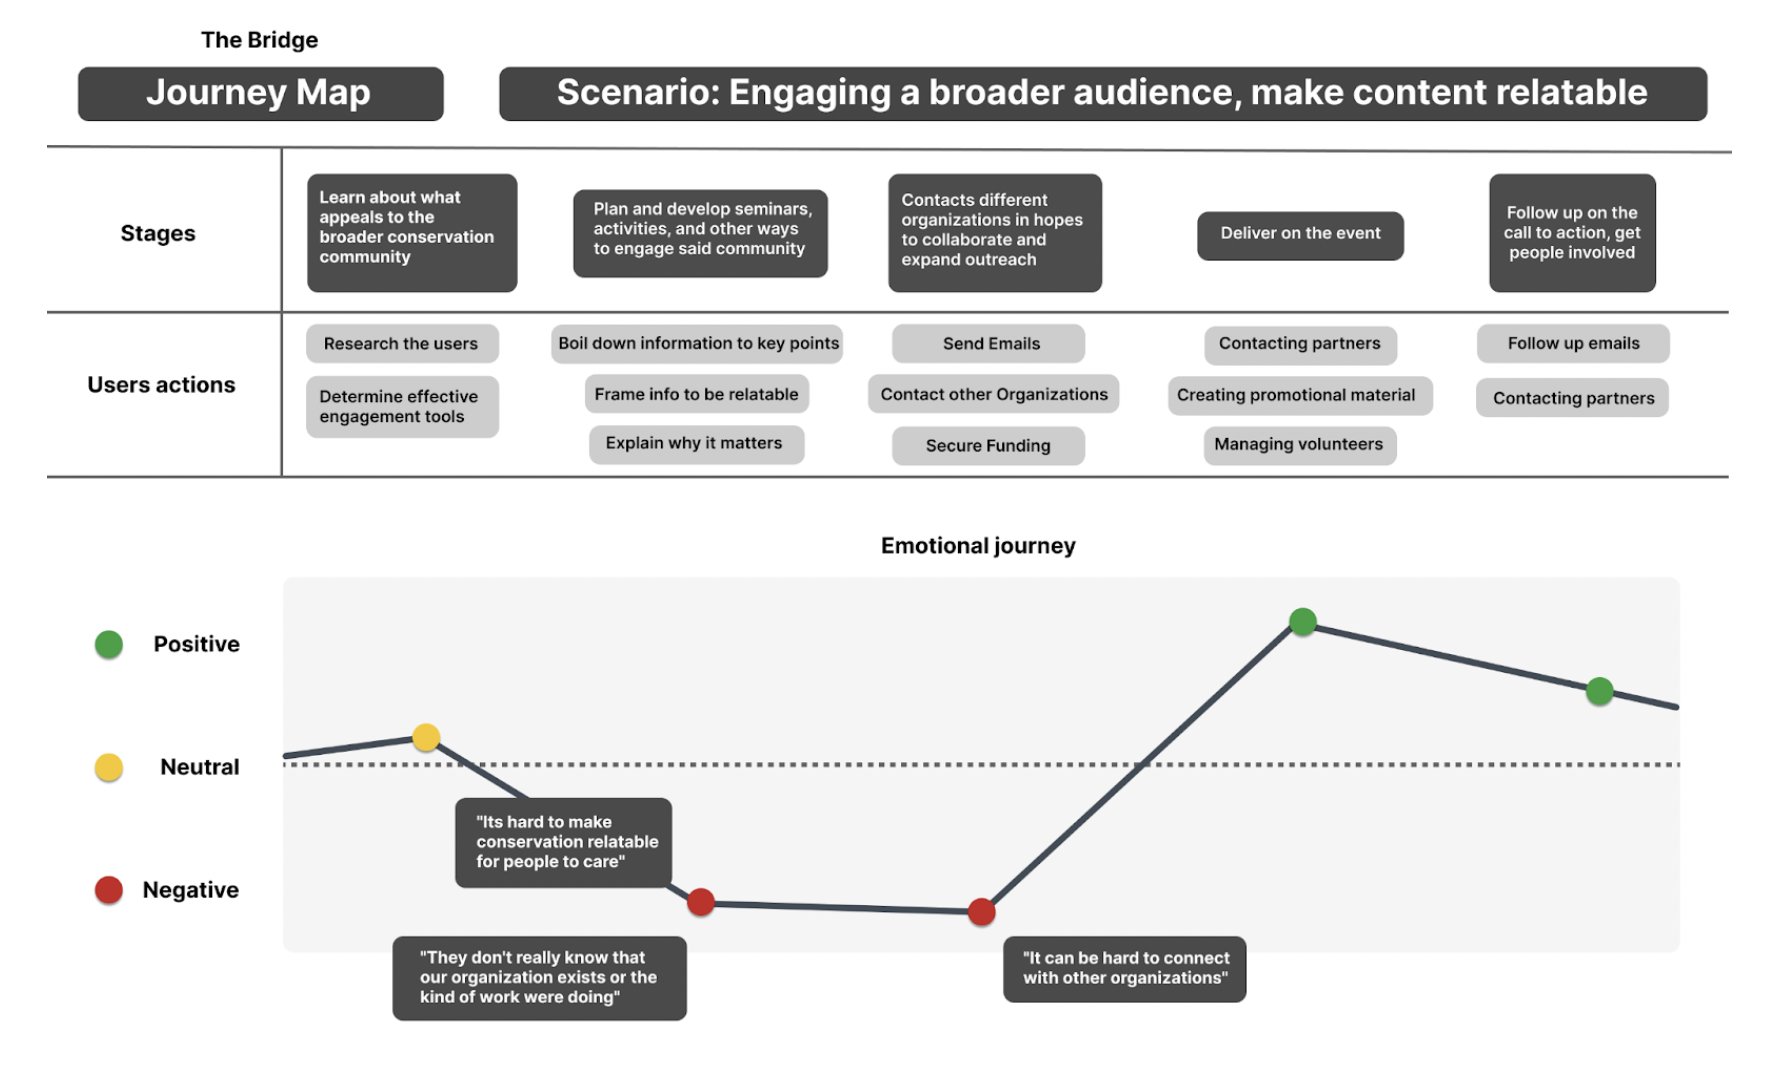
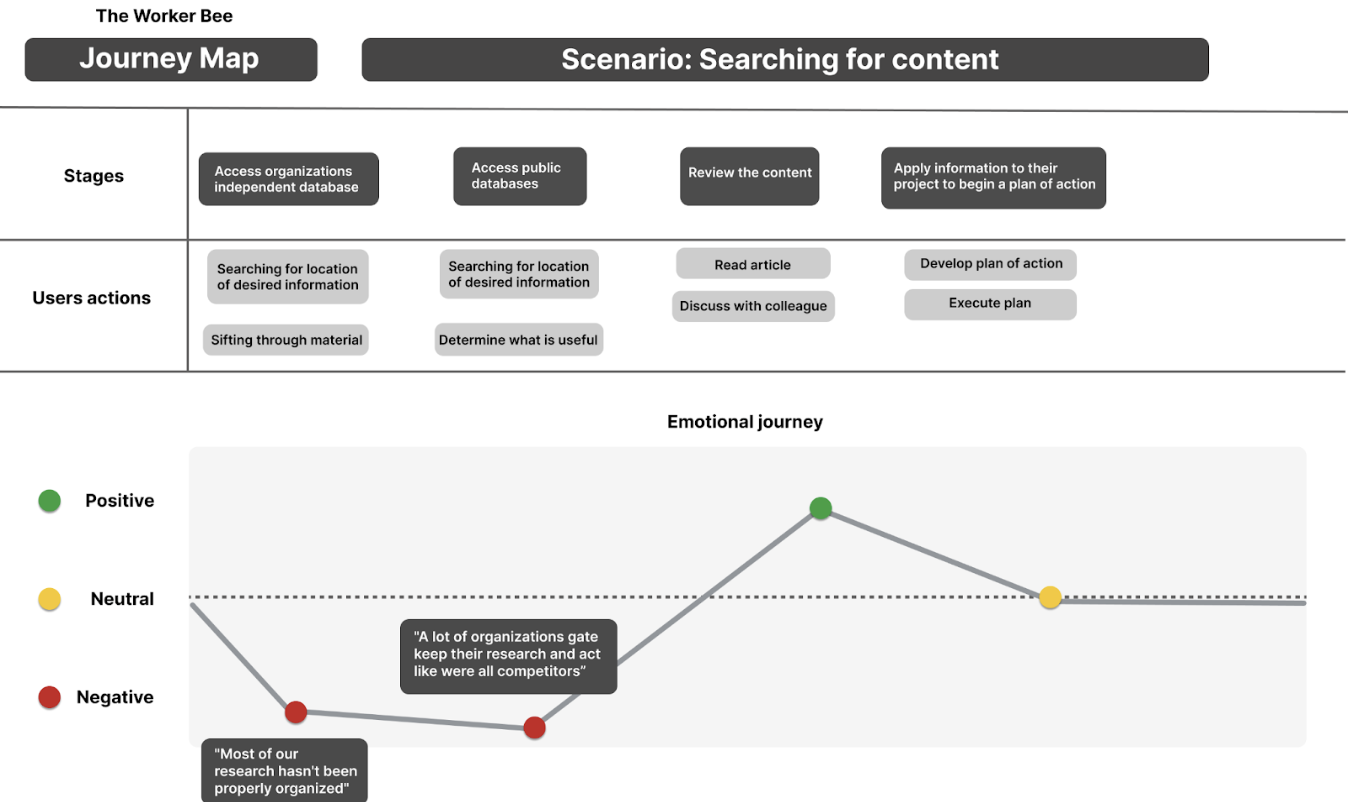
In our user interviews, we identified key patterns between various professionals that allowed us to associate them with a particular essence of a person. These essences describe the thought process, goals, frustrations, and responsibilities of each archetype of the user. We used these throughout our design process to help quickly see from the lens of our users.
Journey maps allowed us to capture one of the user-identified tasks for each persona. In doing this, major pain points and roadblocks are revealed to help remind us of which part of the process we need to pay closer attention to.
4. Key Takeaways & Research Results
Our research highlighted several key needs and challenges for conservation professionals in accessing and utilizing information:
Access to Reliable Information: Conservationists face challenges finding credible, centralized information, often relying on diverse sources like private databases, guidebooks, and peer consultations. For example, one interviewee noted a lack of research on Asian elephants, forcing reliance on less relevant African data, highlighting gaps in region-specific resources.
Region-Specific Data: Region-specific information is critical for decision-making but often hard to obtain. Professionals depend on tools like Panorama Solutions or keyword searches yet still struggle to find relevant data for their regions, ecosystems, and species.
Effective Communication: Efficient collaboration is key to conservation success, but issues like competition and research withholding limit progress. While tools like Miradi Share and Salesforce aid communication, better methods for sharing knowledge can prevent repeated mistakes and drive conservation forward.
Information Credibility: Reliable, consolidated resources are essential for sound strategies. Conservationists rely on case studies and reports, but scattered or unreliable online data wastes time and risks flawed decisions.
Conclusion: Our research highlights conservationists’ needs for trustworthy, region-specific information and better communication tools. Addressing these gaps through a unified, credible platform can improve conservation outcomes significantly.
Planning & Ideation Phase.
Affinity Mapping
For our interview results we created an affinity diagram to help visualize our discoveries. Any interesting and insightful points, as well as common patterns and responses among participants, were recorded and categorized.
2. Pain points, Opportunities, and Functional Requirements
All pain points were directly obtained through user interviews, as well as subsequent personas. Outlining problems like these are not only meant to remind us of what to design around, but they also help inform critical design opportunities.
1. Limited Time for Training and Work
Practitioners often “learn on the fly” due to limited time and funding.
Opportunity: Provide time-efficient tools and resources to streamline learning and project execution.
2. Inefficient Communication
Communication primarily occurs via email, leading to lost information in large threads.
Opportunity: Create a centralized communication platform to manage discussions and updates more effectively.
3. Lack of Shared Knowledge
Organizations work in silos, repeating mistakes due to limited access to project insights.
Opportunity: Offer related articles, testimonials, and feedback from completed projects to promote collaboration.
4. Community Awareness Issues
Conservation initiatives often face backlash from uninformed local communities.
Opportunity: Develop tools to help practitioners engage with communities via events or outreach programs.
5. Difficulty Accessing Relevant Information
Practitioners struggle to find region-specific data or identify research context quickly.
Opportunity: Implement tags and filters for ecosystem, region, and context to streamline searches.
6. Outdated Information
Practitioners face uncertainty about the relevance of data in evolving fields.
Opportunity: Highlight updates or corrections to older data and use tags to indicate relevance during searches.
7. Overreliance on Research Papers
Practitioners value visual aids but most databases rely solely on text.
Opportunity: Include multimedia resources, such as videos and infographics, to enhance accessibility for visual learners.
8. Credibility Concerns
Users struggle to verify the reliability of resources and often consult colleagues.
Opportunity: Add discussion features or comment sections for users to share opinions and assess resource credibility.
9. Information Overload
Text-heavy resources overwhelm users, reducing engagement.
Opportunity: Use summaries, previews, and interactive features to make content more digestible.
10. Fragmented Research Sources
Practitioners rely on multiple platforms, which is time-consuming and disorganized.
Opportunity: Consolidate resources into a unified platform to simplify access and save time.
11. Volunteer Burnout
Nonprofits rely on unpaid workers, leading to challenges in sustaining motivation.
Opportunity: Provide tools to support volunteers and streamline their workload to prevent burnout.
These identified opportunities became a key focus as we progressed into the prototyping phase.
Identified Functional Requirements:
Offline Access
In our research we discovered that practitioners work in a multitude of locations ranging from their office, in the field, community events and conferences.
Spatial Search
By allowing users to search for region-specific information, the number of results they will be required to sift through during their search process will be reduced.
Search Tags (Metadata)
Provides users with an information scent to help them determine if the result will meet their current informational needs.
Bookmarking
Our user group often refer to the information they read multiple times as they perform their tasks.
Linking Relevant Articles
This information seeking behavior helps users to gain a better understanding of what they are searching for. It also allows them to find other relevant information and engage in berry picking.
Design & Prototyping Phase.
High-Fidelity Prototypes
Using the information and research gathered through previous phases, we built upon our iterations to create a high-fidelity prototype. It was critical to implement our identified design goals and apply opportunities that were discovered based on user pain points.

